Distributed Tracing
Distributed tracing enables the visualization of the flow of function calls across microservices, processes, and the steps of an agentic workflow. Without distributed tracing, it’s extremely challenging to troubleshoot a distributed system. Microbus leverages OpenTelemetry to automatically create and collect tracing spans for executions of endpoints, tickers and callbacks of all microservices and visualize them as a single stack trace.
Configuration
Microbus exports tracing spans via the OTLP collector. The OTEL_EXPORTER_OTLP_TRACES_ENDPOINT or the OTEL_EXPORTER_OTLP_ENDPOINT environment variables may be used to configure the collector’s endpoint.
Whether or not a trace is exported to the collector depends on the deployment environment of the microservice:
- In
LOCAL,TESTINGandLABdeployments, all traces are exported to the collector - In
PRODdeployments, only traces that contain at least one error span, or those that are otherwise explicitly selected usingsvc.ForceTrace, are exported to the collector
All OTLP exporters in one executable that target the same endpoint over the same protocol share a single connection to the collector — a bundle of microservices each exporting traces, metrics and logs collapses down to one connection per distinct target rather than one per signal per service.
What a Request Span Records
A server span carries the structural facts about its request — method, scheme, host, port, path, and body size — attached at span creation in every deployment.
It does not record request headers or the query string, in any deployment. Those routinely carry credentials: an Authorization header, a Cookie, a token passed as a query argument. Dropping them is deliberate rather than redacting them by name, because a name-based filter can only know about the framework’s own secrets, never an application’s. The problem is worst exactly where traces are most valuable: in PROD, a forced trace exports precisely the spans around an error, which is the moment a credential would have been attached. Structural attributes are attached unconditionally so that a forced trace still carries useful request context, without ever carrying a secret.
The consequence for troubleshooting is that a span tells you which endpoint was called and how big the payload was, but not what was in it. Anything else a span should carry is an explicit span.SetAttributes call in your own handler, where you choose what is safe to record.
Client IP is the one piece of request identity available, via span.SetClientIP.
svc.TracerProvider() returns the underlying OpenTelemetry tracer provider, so application code can instrument third-party libraries against the same tracing pipeline and resource as the framework. It returns a no-op provider (never nil) when tracing is disabled.
Example
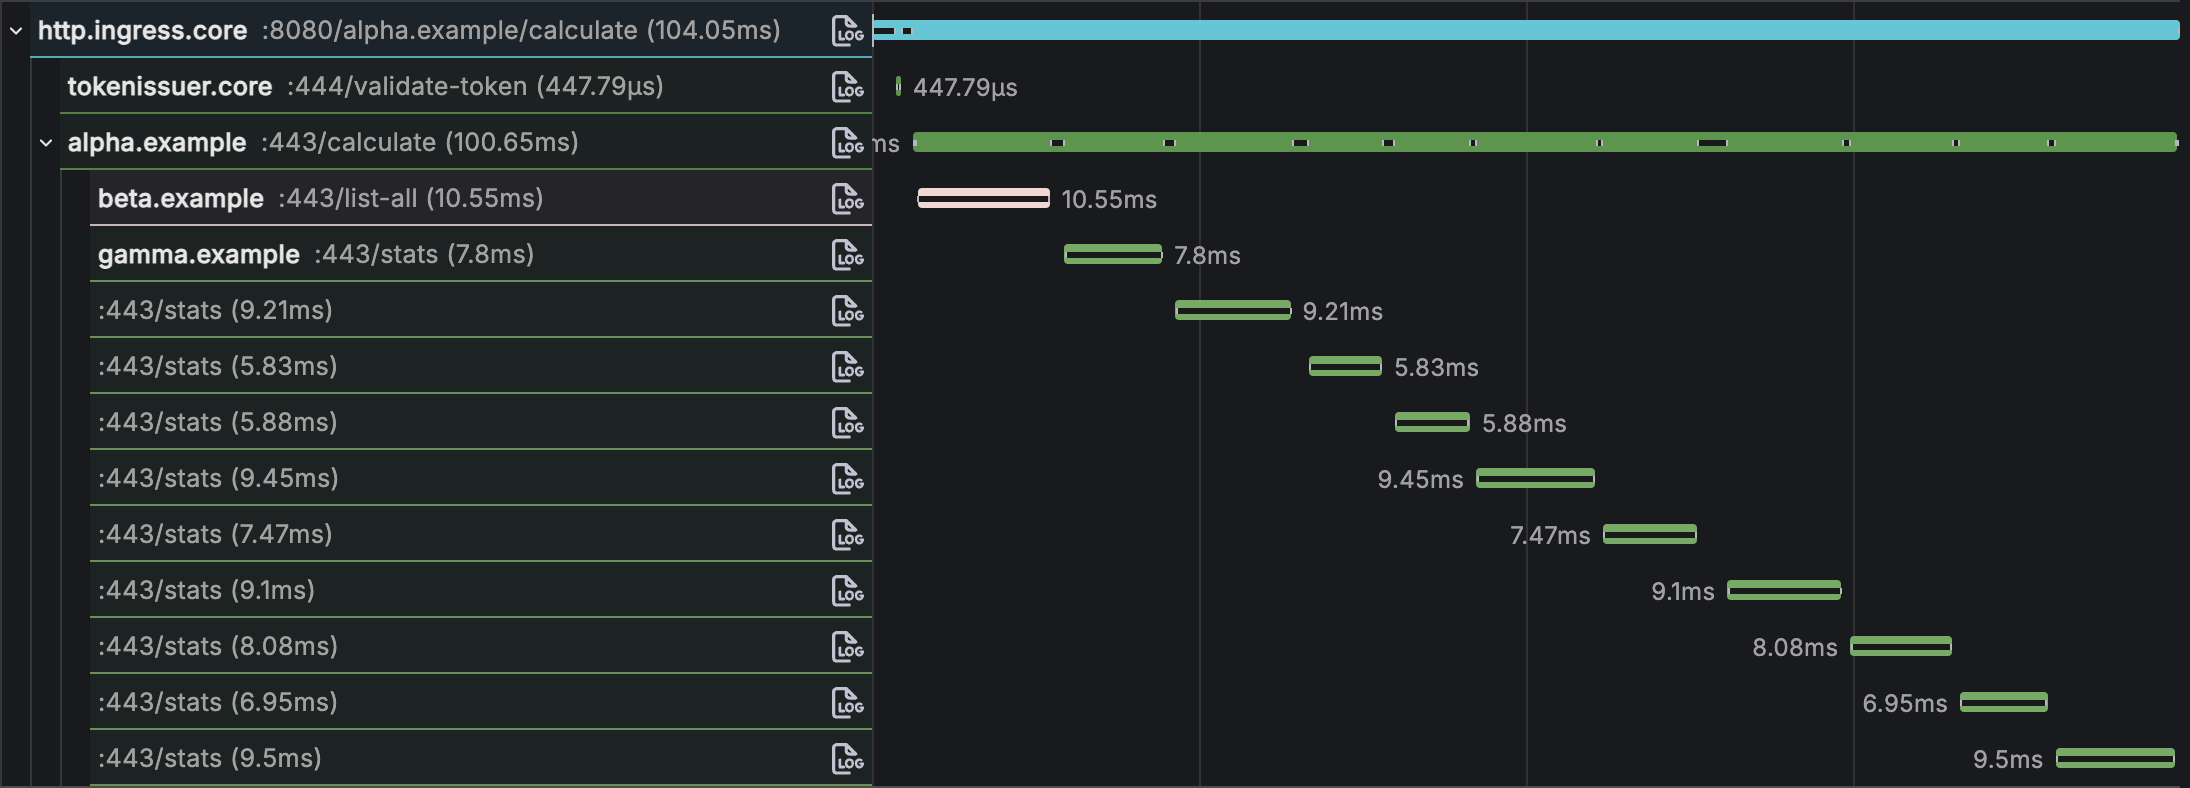
Here’s a visualization of a fictitious microservice alpha using the notorious N+1 anti-pattern. One can easily spot the serialized nature of the code. It took 104ms to complete.
func (svc *Service) Calculate(ctx context.Context) (sigma float64, err error) {
	keys, _ := betaapi.NewClient(svc).ListAll(ctx)
	var amounts []float64
	for k := range keys {
		stats, _ := gammaapi.NewClient(svc).Stats(ctx, keys[k])
		amounts = append(amounts, stats.Amount)
	}
	return svc.stdDeviation(amounts), nil
}
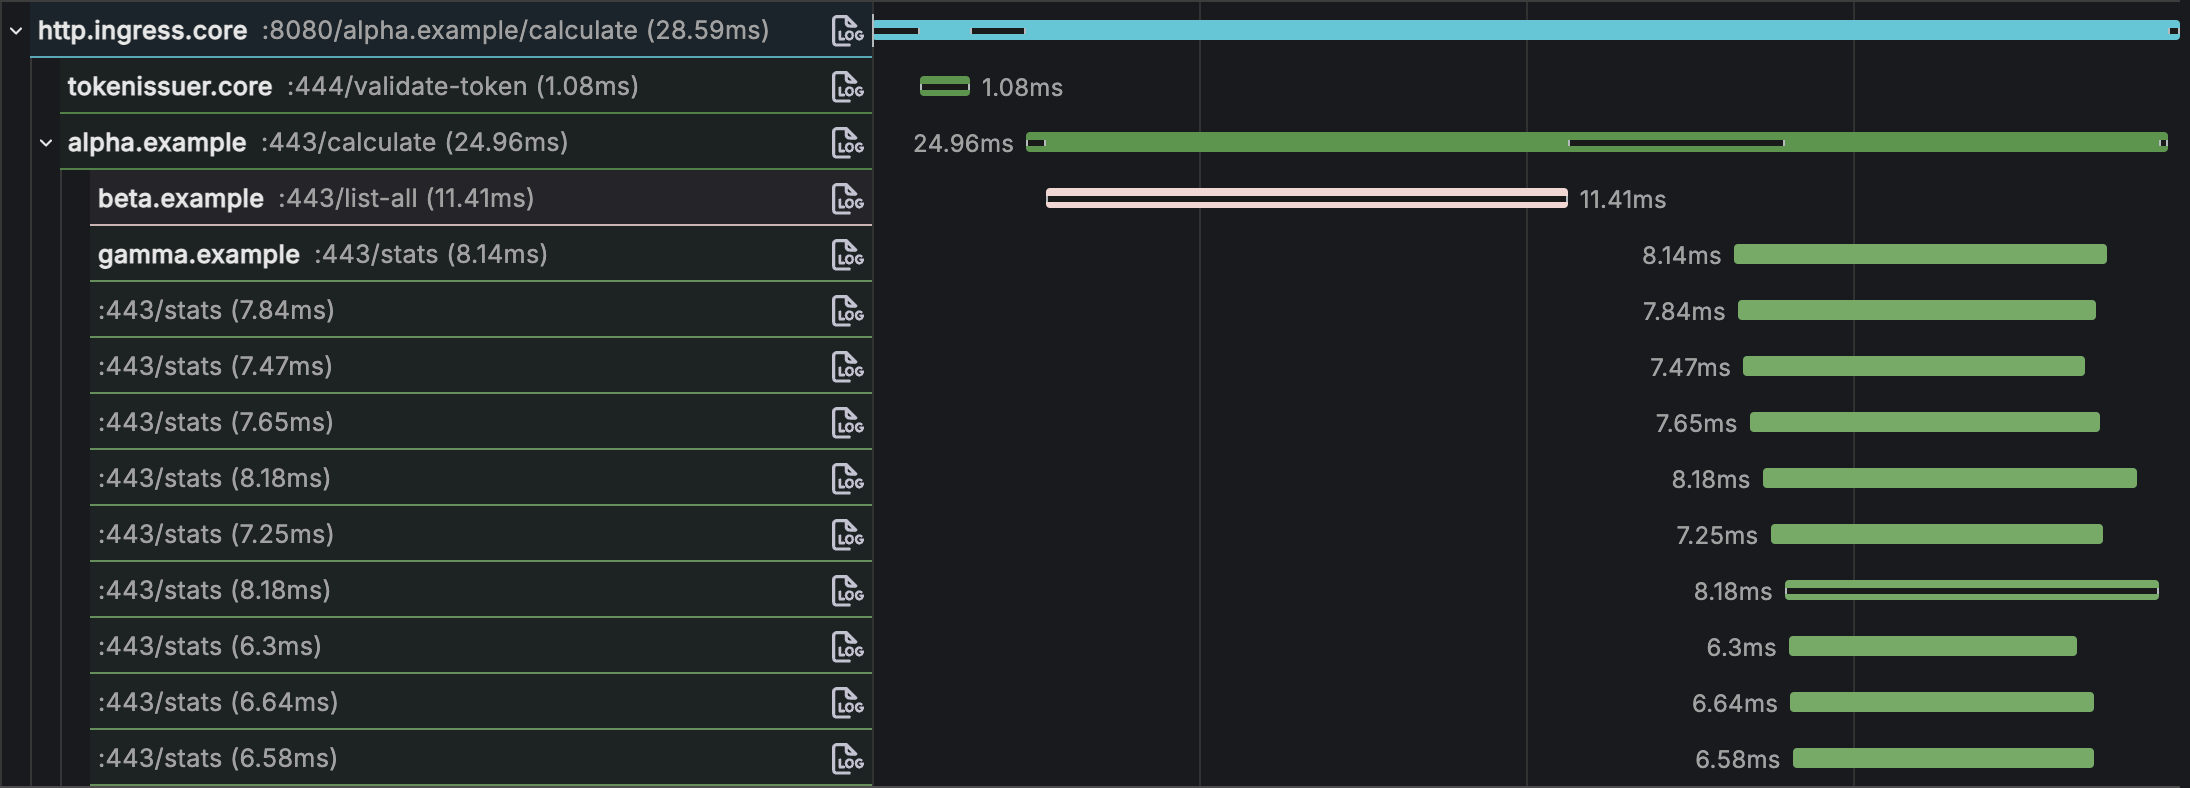
And here’s the same function rewritten to perform the N operations in parallel. It completed in 28ms, almost a 4x improvement.
func (svc *Service) Calculate(ctx context.Context) (sigma float64, err error) {
	keys, _ := betaapi.NewClient(svc).ListAll(ctx)
	amounts := make([]float64, len(keys))
	jobs := []func(ctx context.Context) error{}
	for k := range keys {
		jobs = append(jobs, func(ctx context.Context) error {
			stats, _ := gammaapi.NewClient(svc).Stats(ctx, keys[k])
			amounts[k] = stats.Amount
			return nil
		})
	}
	_ = svc.Parallel(ctx, jobs...)
	return svc.stdDeviation(amounts), nil
}